
Take your reporting to the next level with PayerWatch.
Veracity™ uses intuitive data visualizations of cash flow to convey missed revenue opportunities due to coding errors, deficient patient data captures, poor patient relationship management, and technology failures.
Dashboard Visualization
Assemble a collection of reports into an interactive, customizable dashboard using graphs, charts, text, images and more. Visualize and measure performance indicators that provide at-a-glance insight with as much or as little detail as you need.
Maximize Your Reporting Potential
See what PayerWatch can do for you and your organization

Codes Review

Trending Reports

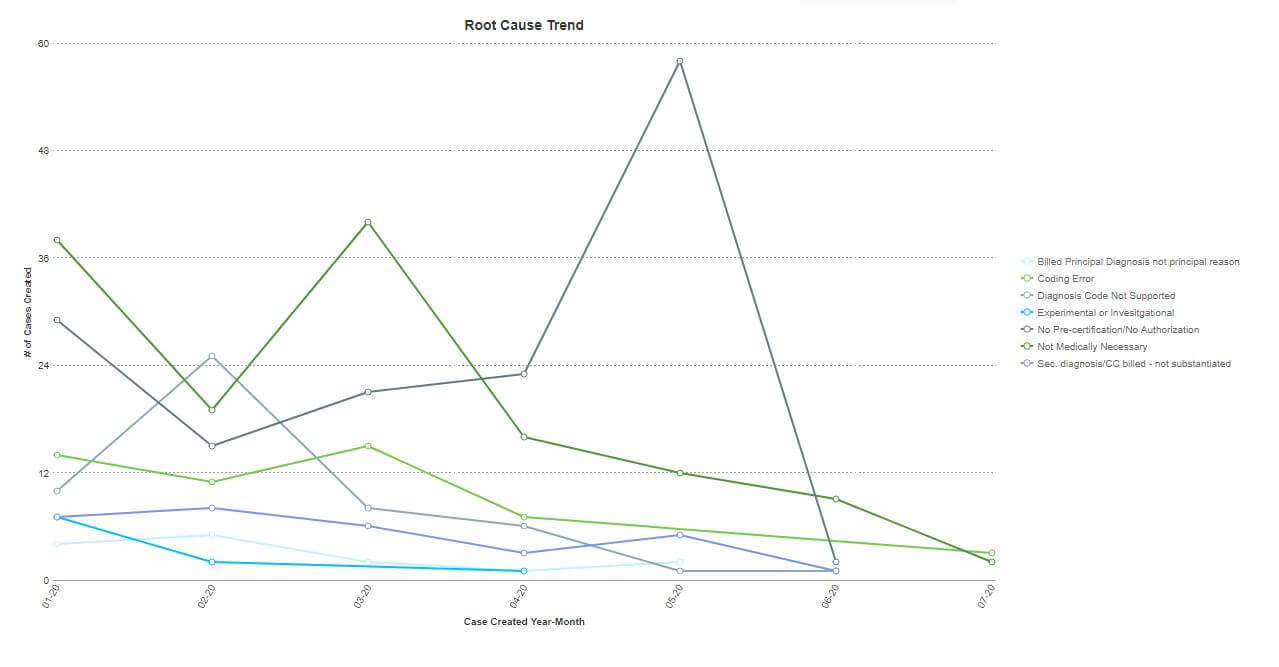
Root Cause

Customizable Task Productivity

Dashboard Data Visualization

Automatic Report Scheduler
Codes Review Reporting
Combining the power of Veracity, codes review, and reporting enables the capability to drill-down on the specific diagnoses or procedures at the heart of denials.
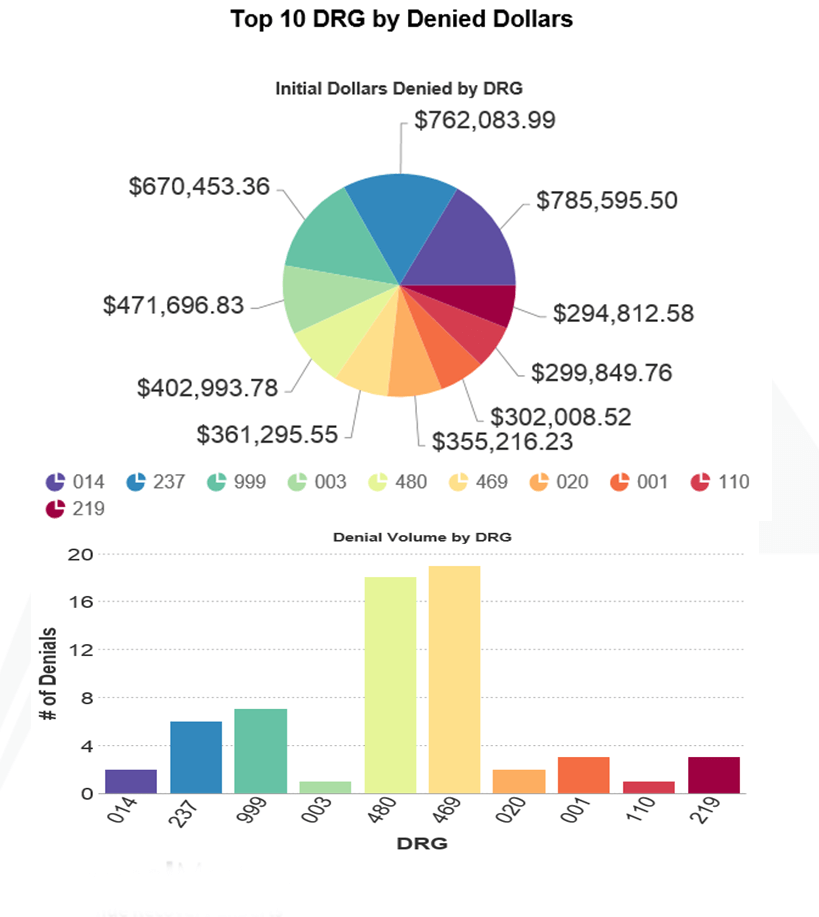
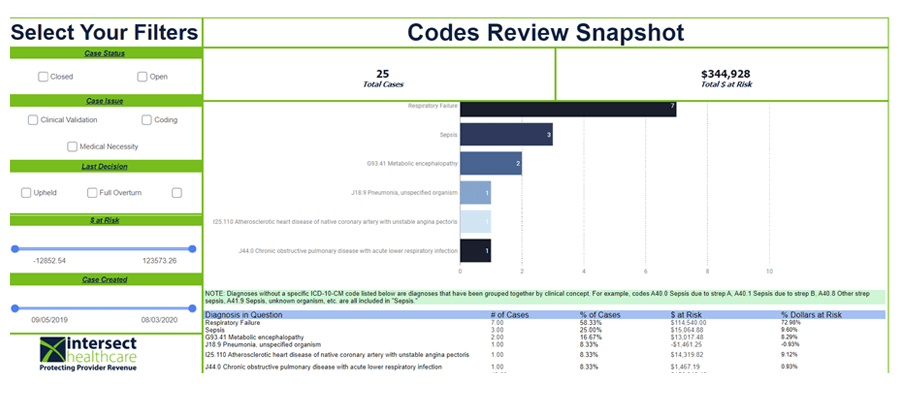
Dashboards are included to give a quick look at cases within codes review
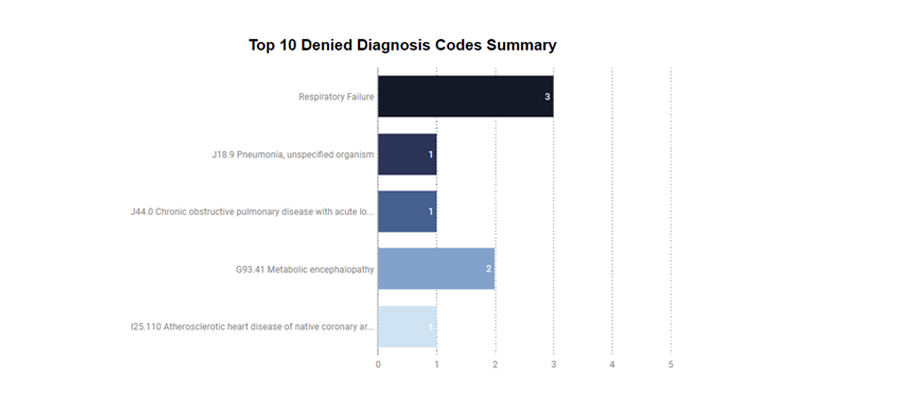
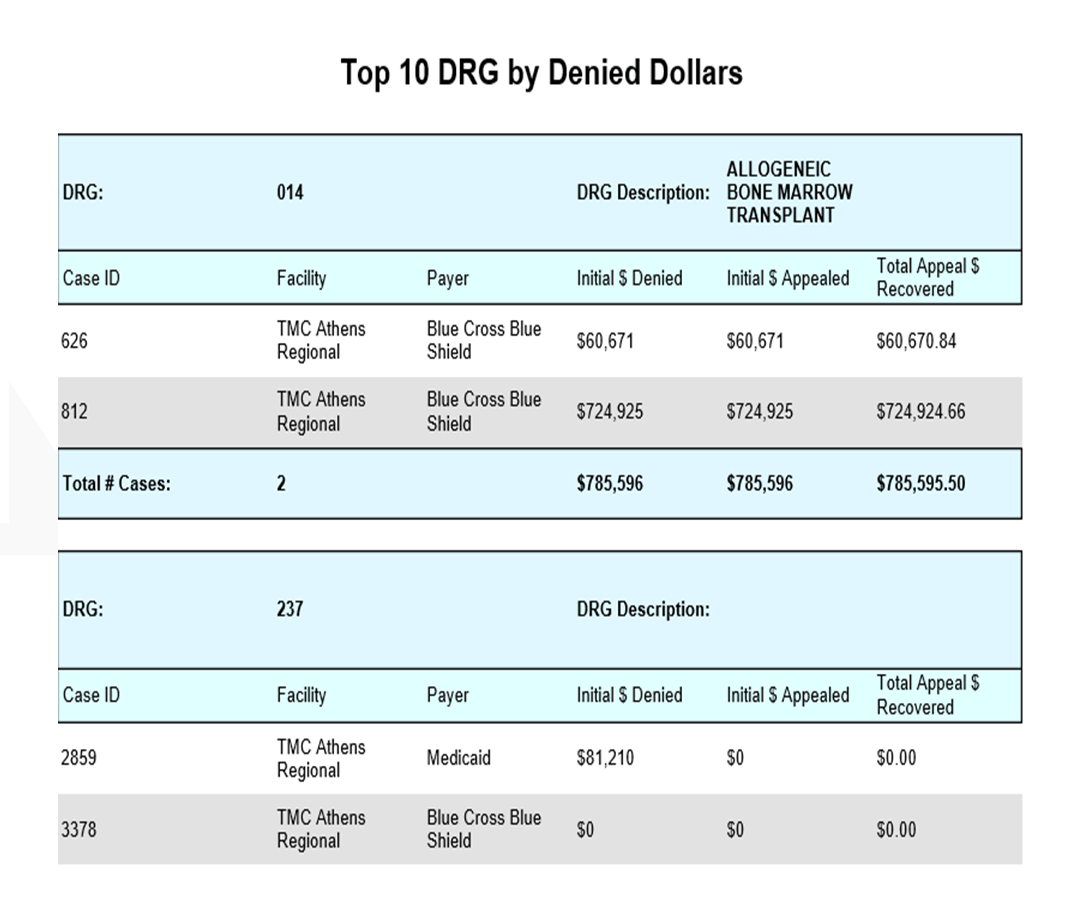
Get a summary of the top 10 denied diagnoses with the ability to drill down into the details, including all the way down to a specific case
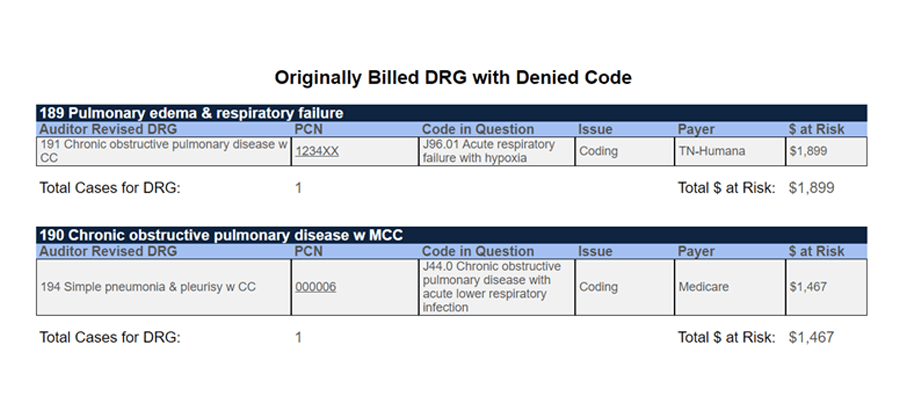
View denied diagnoses wtih PayerWatch
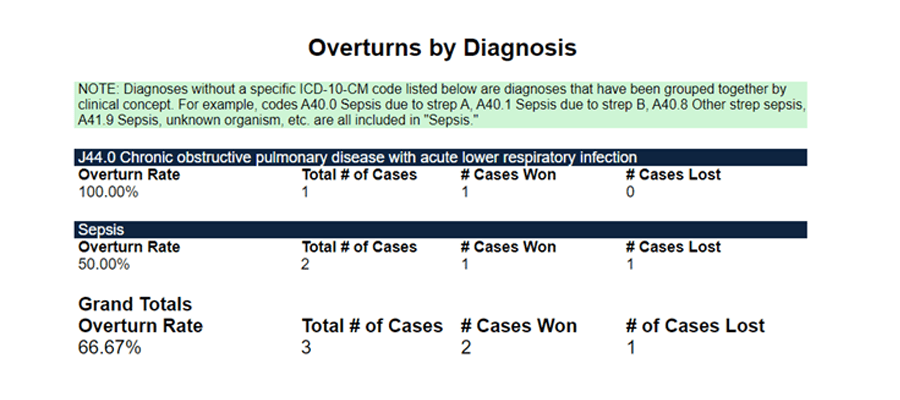
View overturn rates for denied diagnoses / procedures
Drill Down Capabilities
Drill down from high level figures to individual case details. Seamlessly link from your reports to a case in Veracity.
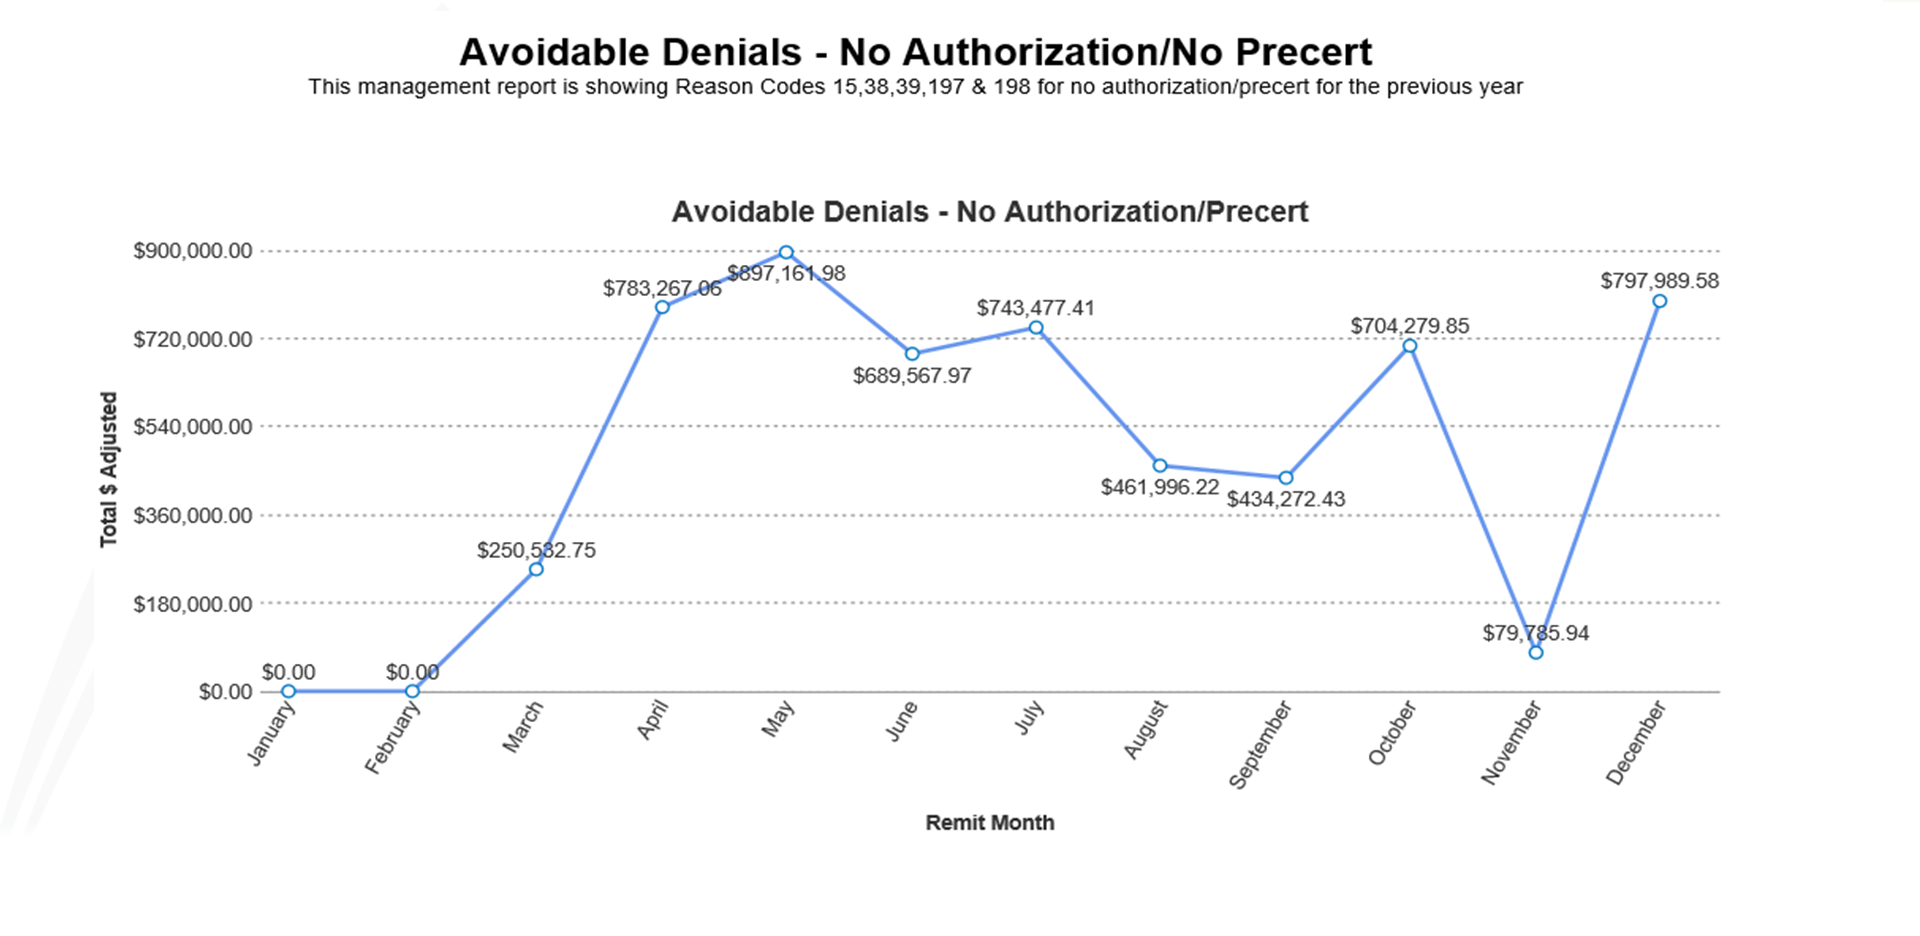
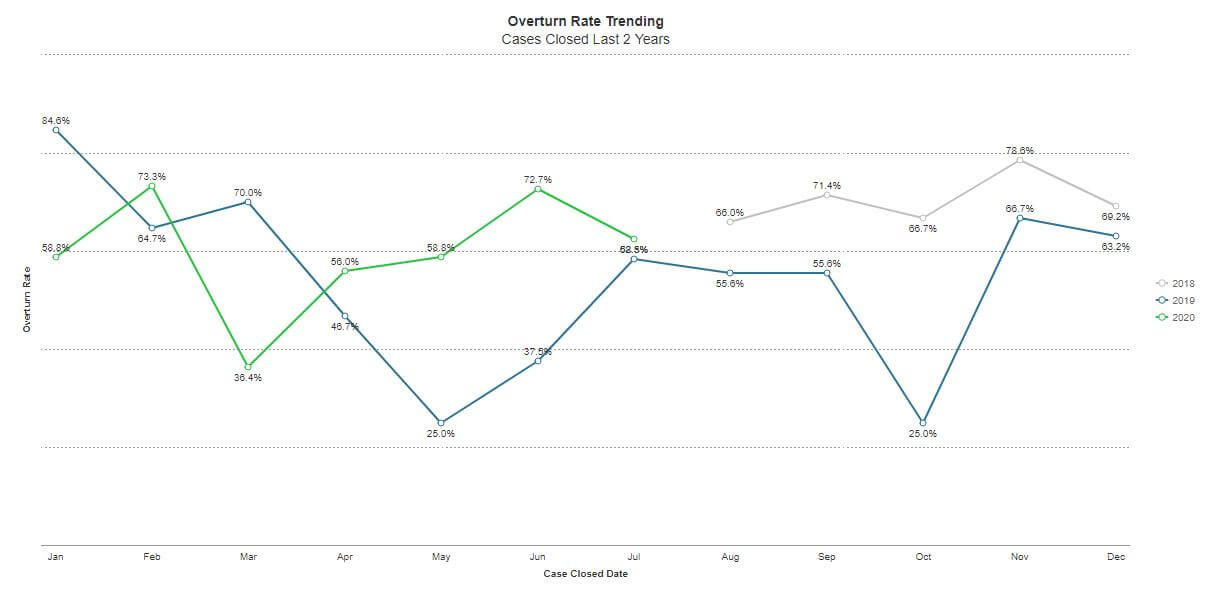
Trending Reports
Trend reports enable you to track and measure data over a set period of time. Trend analytics can predict potential financial risks and opportunities in the long term, helping your company prepare for future growth and success.
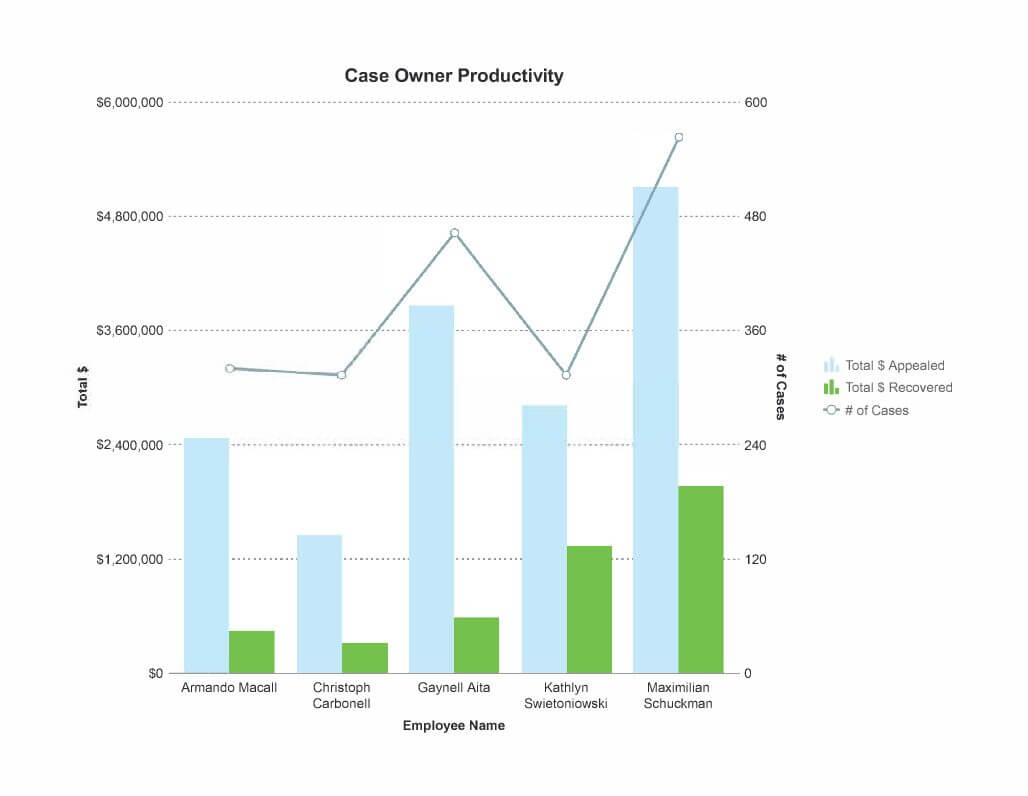
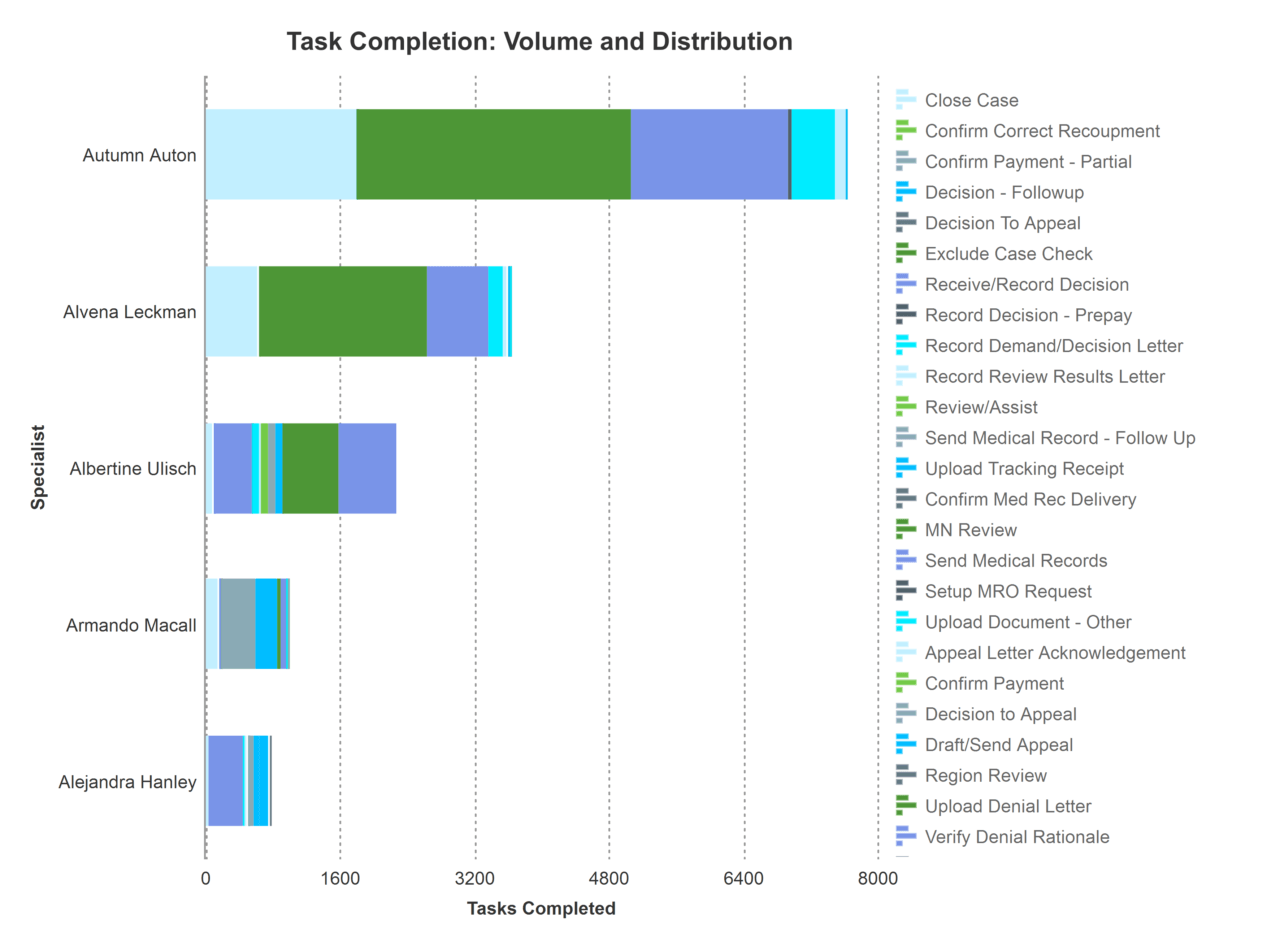
Customizable Task Productivity
Customizable reports allow you to measure and manage your staff’s productivity.
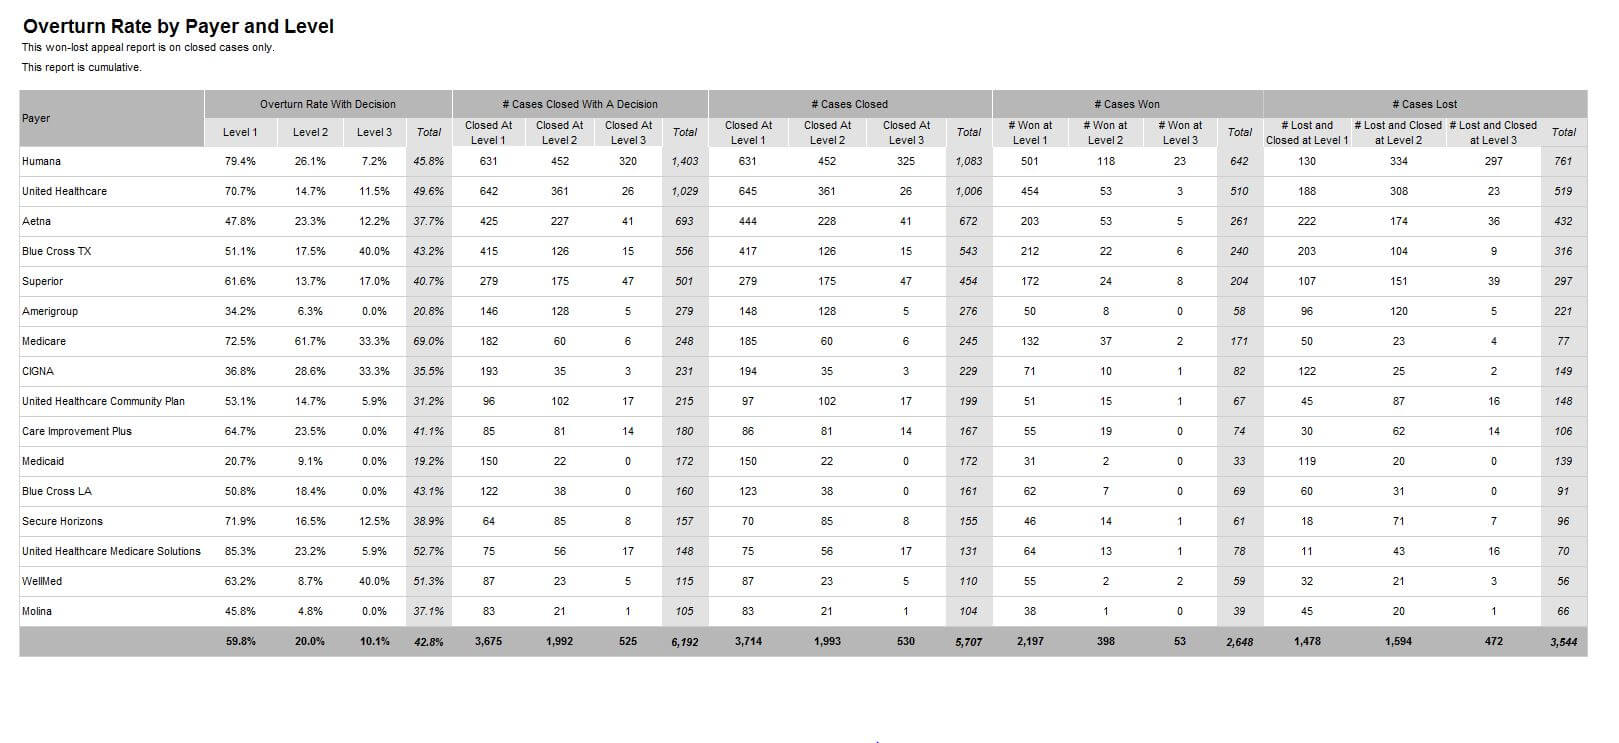
Won/Lost Reporting
Won/Lost reporting provides you an opportunity to keep track of your organization’s success rate, identify areas for improvement, monitor payer behavior, and plan denial prevention strategies.
Automatic Report Scheduler
Free up time spent running daily, weekly, monthly or yearly reports by sending them automatically via a secure e-mail.
Formatting and Features
Line
– Spline, Area, Spline Area, Spark Line, Zoom Line
Bar/Column
– Stack, 100% Stack, Pareto, Spark Column
Pie
– Doughnut, Pyramid, Funnel
Scatter
– Zoom Scatter, Bubble
Combination
- Dashboards
- Gauges
- Benchmark
- Drill Down
- Chained Reports
- Scheduling of Reports
- Export to Excel, PDF, RTF, CSV

PayerWatch's industry-leading Veracity software and AppealMasters’ infrastructure is HITRUST CSF Certified.